The table view provides a detailed breakdown of forecast values by week on week. The week starts on a Monday. The forecast is updated every week on Sunday. (this setting can be disabled for on-demand data sync capability)
The forecast is organized into:
1. Operations
Core operating cash activities. It consists of sub-categories of Revenue and Expenses
Examples members:
- Customer Collections
- Payroll
- Marketing & Sales
- Professional Services
- Rent
- Software Expenses
2. Investing
Cash movements related to investments and capital expenditures, categorized into Inflows and Outflows
Examples:
- Equipment Purchases
- Capital Projects
- Asset Sales
3. Financing
Cash movements related to debt and equity activities.
Examples:
- Loan Draws
- Debt Repayments
- Interest Payments
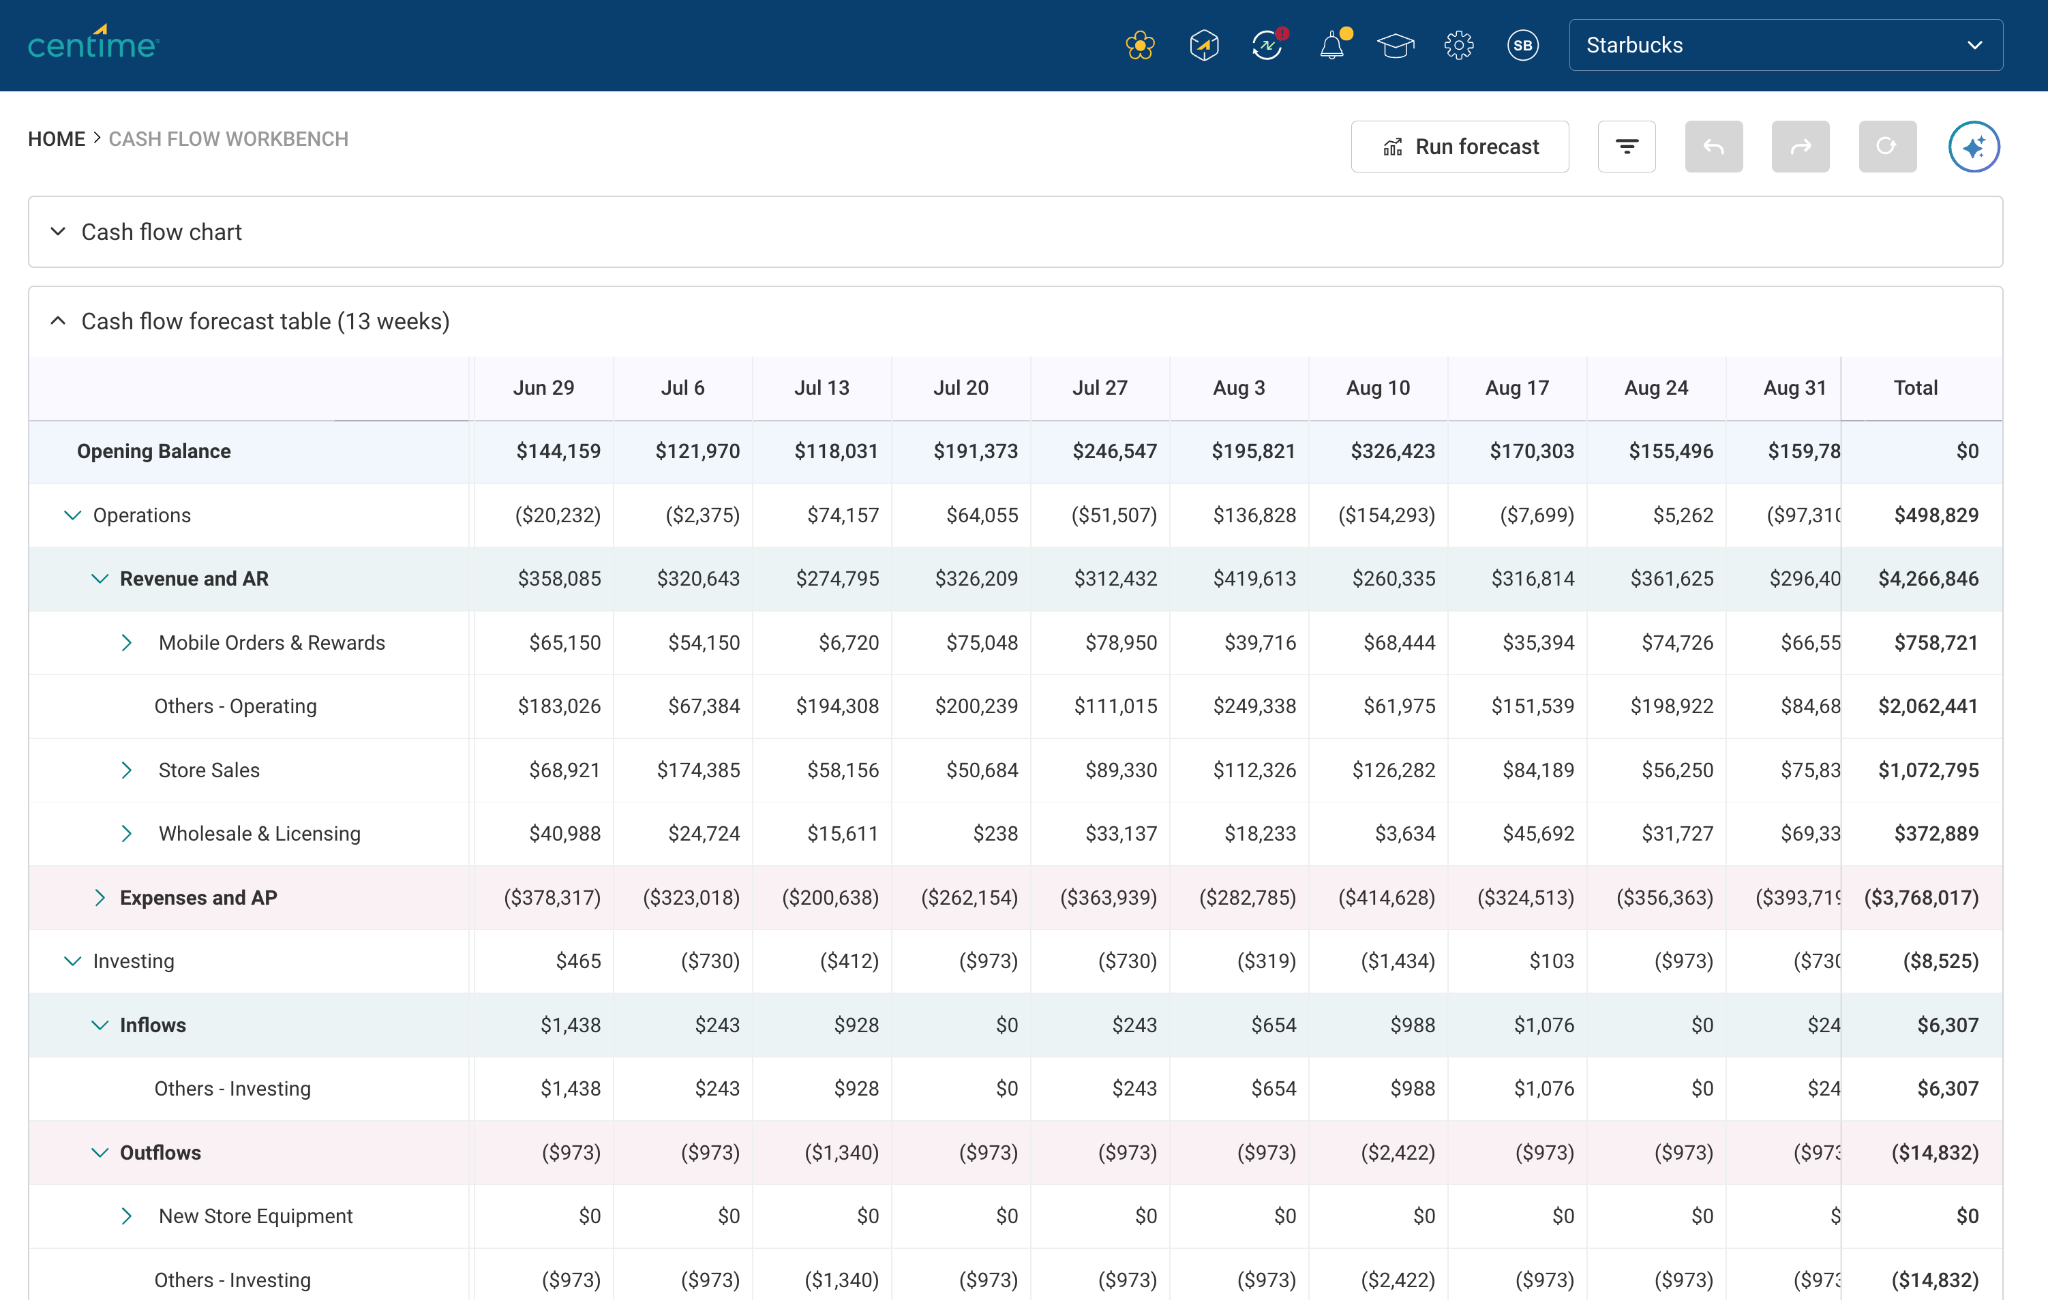
Expanding and Collapsing Groups
Use the expand/collapse controls to view groups and group members. Group members are comprised of the following:
- Suppliers
- Buyers
- Journal Entries, Credit Memo’s, Inter company transfers etc.
Note : All data points that are independent of Supplier and buyer and maintained in your general ledger
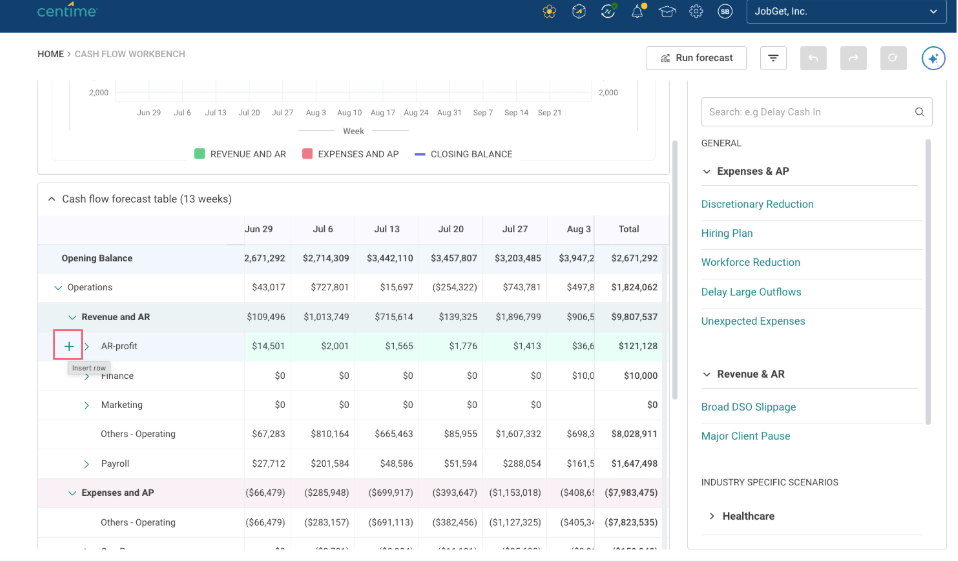
Adding a new row
On hovering on the right side of any group name (not the default ones), + icon can be used to add a row manually. This row sorts automatically once the name is added to it.