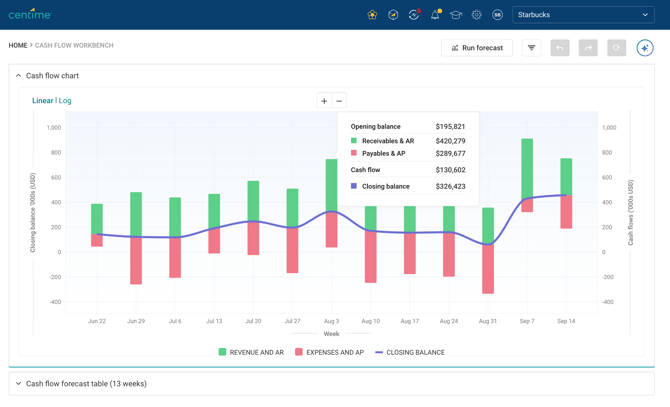
The graph provides a visual representation of your forecasted cash position over the next 13 weeks. It also highlights the updated cash impact after you apply scenarios. It displays
- Revenue & Accounts Receivable inflows
- Expense & Accounts Payable outflows
- Projected Closing Cash Balance
Users can switch between:
Linear View
Linear view displays actual cash values and is best suited for weekly cash management and liquidity analysis.
Log View
Logarithmic view compresses large value ranges and helps identify relative growth or decline patterns when cash movements vary significantly between weeks.